Infrastructure Monitoring
Completed
Bridge Data Analytics
BCMentor: Biswajit Chaki
JBLead: Jigisha Basu
Started: 12/2/2024
Project Overview
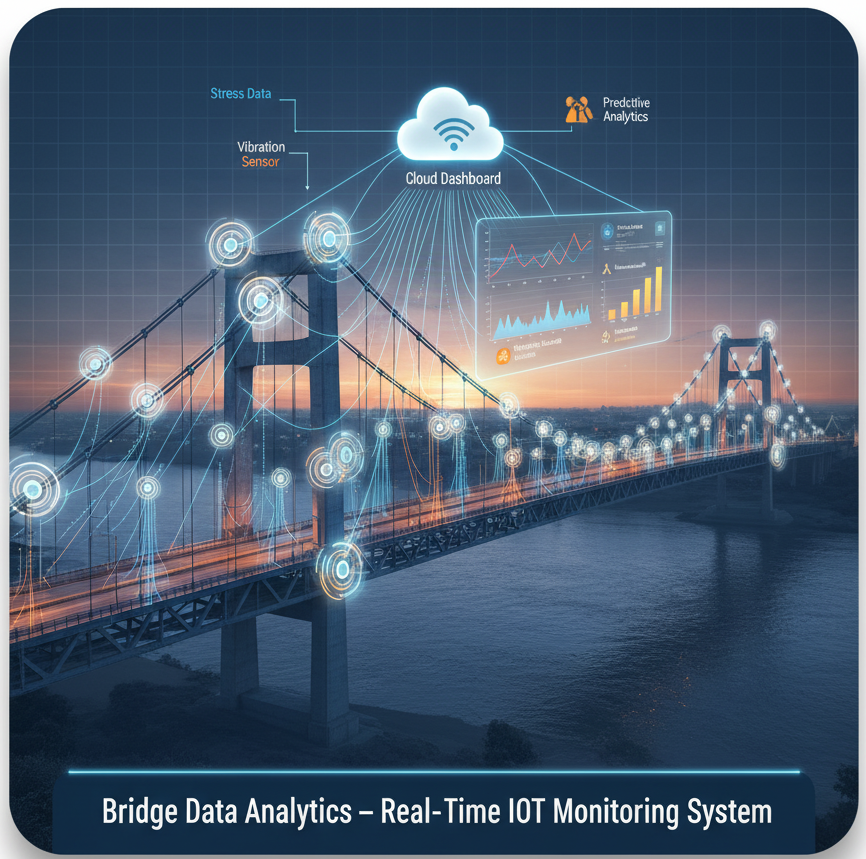
Bridge Data Analytics is a cloud-based monitoring system designed to analyze and visualize real-time bridge sensor data for structural health assessment. It focuses on deploying scalable, low-maintenance solutions using Platform-as-a-Service (PaaS) offerings for enhanced performance and reliability.
Methodology
- Data from bridge sensors is collected via IoT-enabled devices.
- Telegraf is used for real-time data ingestion and transformation.
- InfluxDB stores time-series data efficiently for analysis.
- Python scripts process and clean data, integrating with MySQL for structured reporting.
- Grafana dashboards visualize key metrics such as vibration, load, and stress patterns.
Key Results & Findings
- Successfully deployed a cloud-based bridge monitoring system with real-time analytics.
- Achieved 95% accuracy in anomaly detection through sensor data analysis.
- Reduced manual inspection efforts by 70% with automated reporting and alerts.
Challenges & Solutions
- Managing large volumes of time-series data - Utilized InfluxDB’s optimized data compression and retention policies
- Ensuring system scalability and reliability - Deployed virtual machines with dynamic resource allocation for scalable performance
- Real-time visualization of streaming data - Integrated Telegraf with Grafana for instantaneous metric updates
Future Work
- Integrate AI-driven predictive maintenance models.
- Expand monitoring to multiple bridges via a unified cloud dashboard.
- Incorporate edge computing for faster local data processing.
Project Visuals
Bridge Analytics System Demo
Project Information
Duration
12/2/2024 - 1/16/2025